Jet Stream and Aircraft (QGIS)
Written on November 14th, 2026 by Brandon Kerns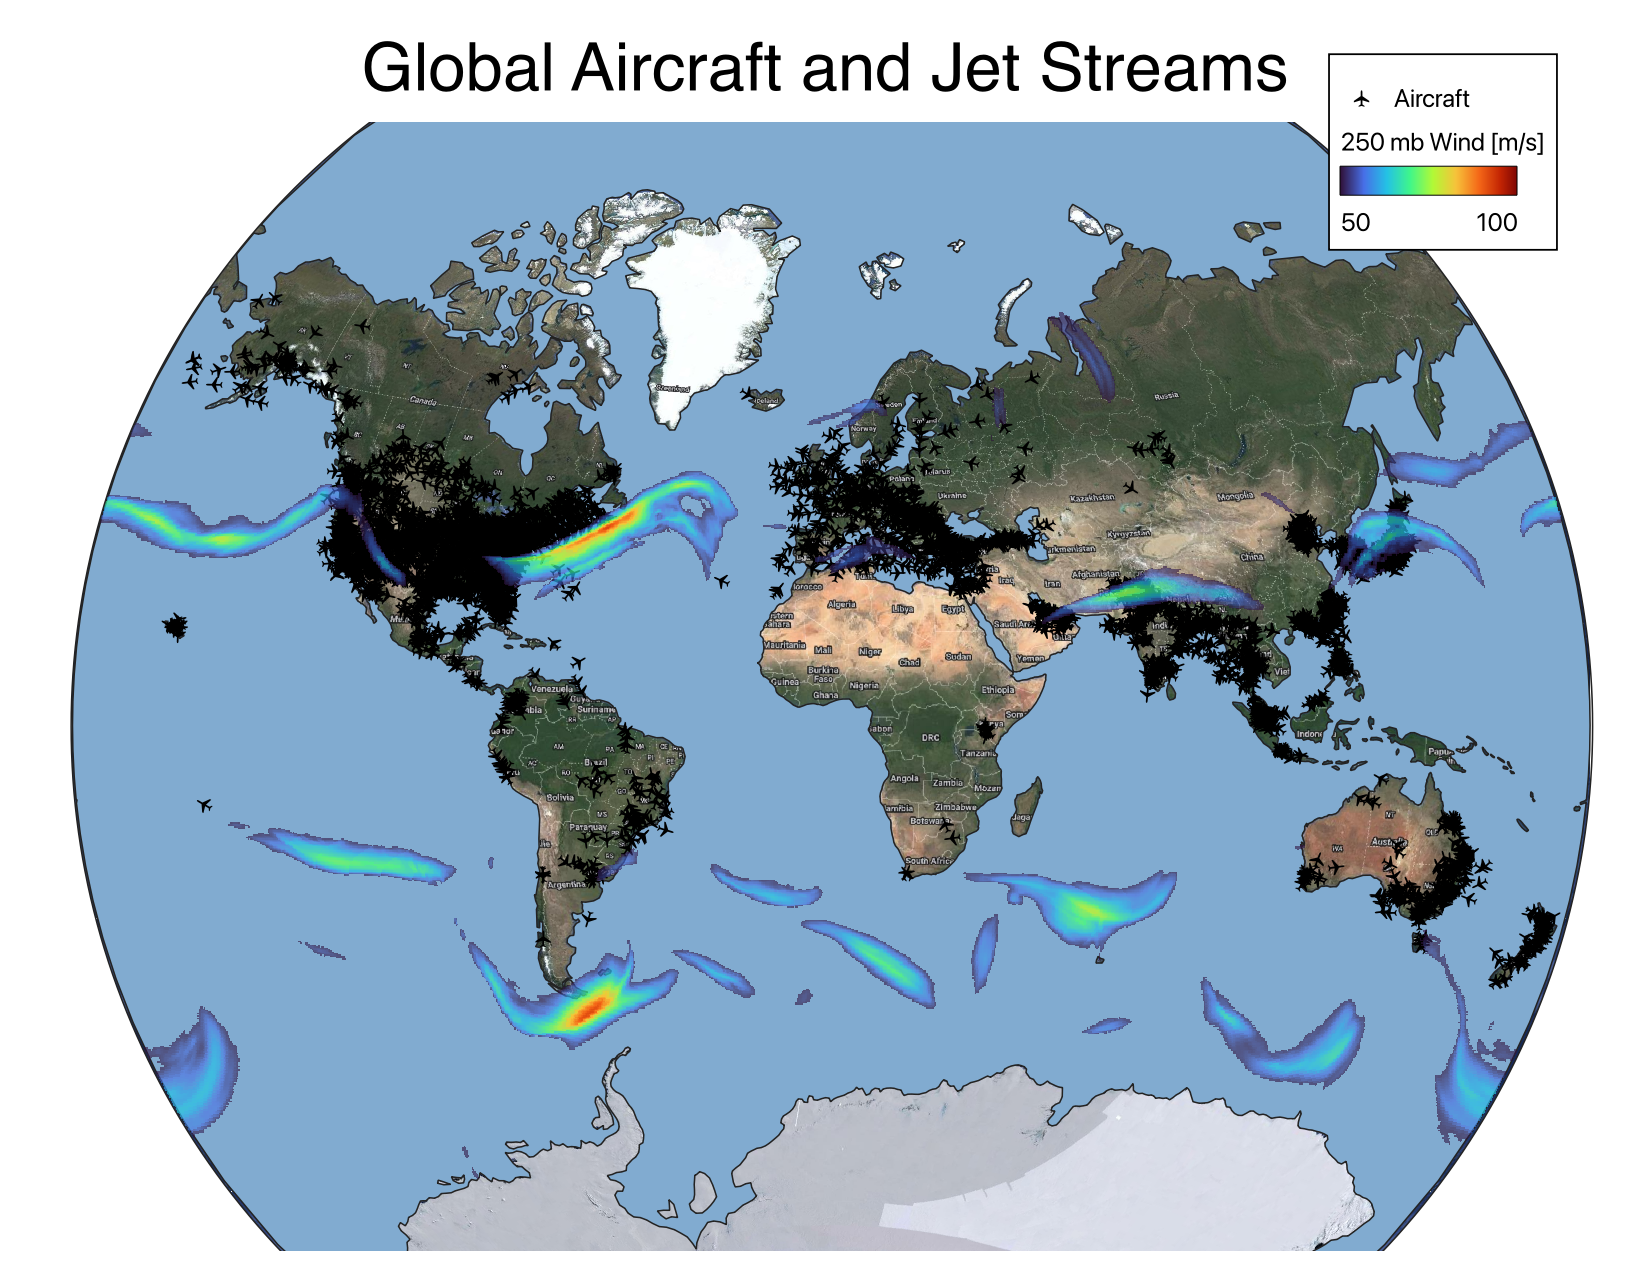
Global jet stream and aircraft
Why should we care?
Flight plans need to account for upper level winds in order to optimize flight times, avoid delays, and save fuel. The jet stream is the strongest upper atmosphere wind phenomenon affecting aircraft.
During El Nino years, the jet stream is often located further south than typical. This can be seen over the Pacific Ocean. The trans-pacific flight paths are typically north of where the jet stream is currently located. Nevertheless, planes leaving the eastern US towards Europe can still take advantage of the jet stresm head winds.
Data used
- Google hybrid base layer (web map)
- ECMWF atmospheric analysis (raster)
- Aircraft locations (vector)
Tools used
- QGIS to project the data, set up the map layers, and set the symbology.
- QGIS Contrail plugin to pull the current locations of aircraft.
- Python to convert the 250 mb wind data from NetCDF to geotiff.
Description of the map
- Van der Grintin projection is used. This was programmed into QGIS as a custom CRS. See here for details.
- Basemap is Google hybrid satellite map.
- Ocean is too dark and cluttered with detail in the Google map. Therefore, it is overlaid with a global ocean vectory layer and represented with a single lighter color.
- Aircraft are plotted as a single marker regardless of aircraft type.
- 250 hPa wind speeds > 50 m/s are rendered, with greater opacity for the highest wind speeds. This allows most of the planes in the jet stream to be visible beneath the color shading.
Feel free to share!